The Leslie Matrix Model of Population
- Richie Sawant
- Feb 9, 2021
- 3 min read


An example of the Markov chain for a Leslie Model of Population growth
We Consider the Following question to study the Leslie Model:
This is not a part of my school curriculum, I have a genuine interest in studying Markov Chains, and being a Math Fanatic I have stumbled upon this question
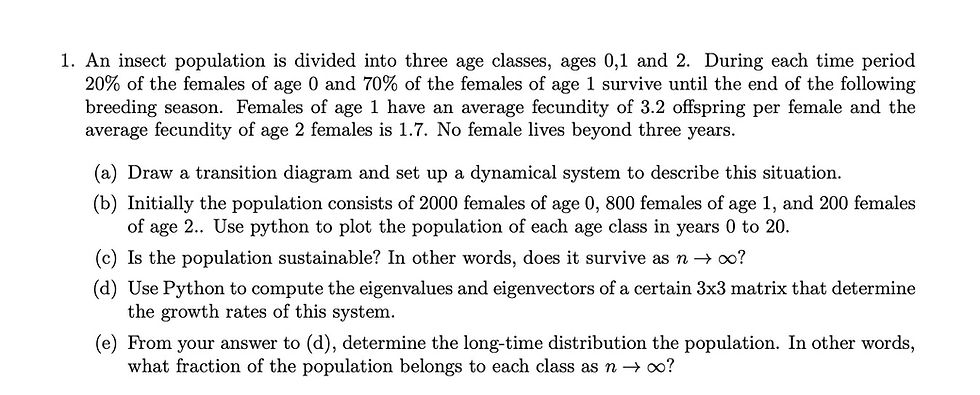
This is the Transition diagram of the process
Used draw.io amazing website to create these flow-charts

Code that calculates the population for n number of years
#Selecting the No of years
n = 20
# Creating Lists
A0 = [0]*(n+1)
A1 = [0]*(n+1)
A2 = [0]*(n+1)
#Setting the Initial Conditions
A0[0] = 2000
A1[0] = 800
A2[0] = 200
Setting the Probability rates and Fecundity rates
#Probablity rates

p0 = 0.2
p1 = 0.7
p = [p0, p1]

# Fecundity Rates
f0 = 0
f1 = 3.2
f2 = 1.7
f = [f0, f1, f2]
Data Frame that plots Insect Population for 20 years
#Loop that gives us the values
import pandas as pd
for i in range(1, n+1):
     #A1[i] = int(p0*A0[i-1])
     A1[i] = p0*A0[i-1]
     #A2[i] = int(p1*A1[i-1])
     A2[i] = p1*A1[i-1]
     #A0[i] = int(f1*A1[i-1] + f2*A2[i-1])
     A0[i] = f1*A1[i-1] + f2*A2[i-1]
Insects_df = pd.DataFrame({'Age 0':A0, 'Age 1':A1, 'Age 2':A2})
Insects_df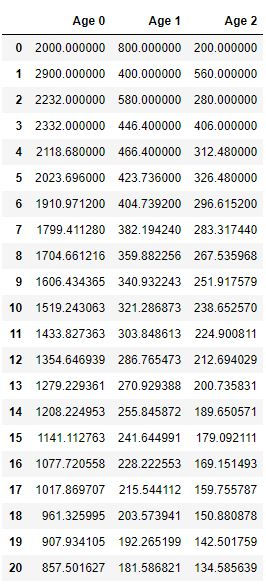
These are the ratios after n years
Rat0 = A0[-1]/(A0[-1]+A1[-1]+A2[-1])
Rat1 = A1[-1]/(A0[-1]+A1[-1]+A2[-1])
Rat2 = A2[-1]/(A0[-1]+A1[-1]+A2[-1])
print(Rat0, Rat1, Rat2)
0.7306130690201319 0.15471656317788768 0.11467036780198044
Plot of a Population of all 3 Age Groups from 0 to 20 years
import matplotlib.pyplot as plt
plt.figure(figsize=(10, 10))
plt.plot(range(n+1), A0, label = "Pop. of Age 0")
plt.plot(range(n+1), A1, label = "Pop. of Age 1")
plt.plot(range(n+1), A2, label = "Pop. of Age 2")
plt.legend()
plt.show()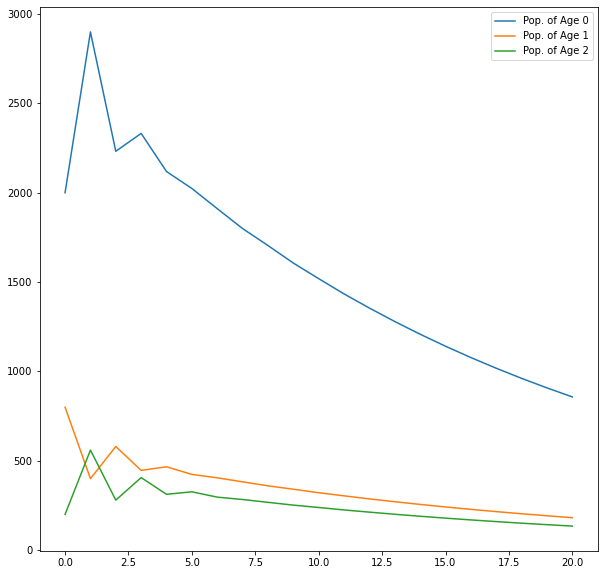
As we see there is a slow decline in the population over the years and it tends to 0 as we further increase the number of years.
Function to compute the Leslie Matrix i.e. the 3×3 matrix
import numpy as np
def leslie(f, s):
    f = np.atleast_1d(f)
    s = np.atleast_1d(s)
    if f.ndim != 1:
        raise ValueError("Incorrect shape for f.  f must be one-dimensional")
     if s.ndim != 1:
        raise ValueError("Incorrect shape for s.  s must be one-dimensional")
      if f.size != s.size + 1:
        raise ValueError("Incorrect lengths for f and s.  The length of s must be one less than the length of f.")
      if s.size == 0:
        raise ValueError("The length of s must be at least 1.")
      tmp = f[0] + s[0]
      n = f.size
      a = np.zeros((n, n), dtype=tmp.dtype)
      a[list(range(1, n)), list(range(0, n - 1))] = s
      a[0] = f
      return a
leslie1 = leslie(f, p)
Eigenvalues and Eigenvectors of the above matrix
eigenvalues,eigenvectors = np.linalg.eig(leslie1)

print(eigenvalues)

[ 0.9444559 +0.j  -0.47222795+0.17028713j -0.47222795-0.17028713j]

print(eigenvectors)

[[-0.96697289+0.j  0.82552166+0.j   0.82552166-0.j ]
 [-0.20476825+0.j  -0.30939613-0.11156938j -0.30939613+0.11156938j]
 [-0.15176757+0.j   0.35307837+0.29270455j  0.35307837-0.29270455j]]
For Eigenvalues We get λ1 = 0.94455 |λ2| = |λ3| = 0.502 As |λ2| = |λ3| < |λ1| < 1 we observe a decreasing population with time as we can observe in the diagram too.
X × L = X We get the probability dist X at n -> Infinity
def MarkovInfinitySolver(leslie):
    n = len(leslie)
    M = np.zeros((n, n), dtype = (leslie[0][0]).dtype)
    for i in range(n):
        for j in range(n):
        if i == j:
            M[i][j] = leslie[i][j] - 1
        else:
            M[i][j] = leslie[i][j]

     M[-1] = 1
     B = np.zeros(n, dtype= (leslie[0][0]).dtype)
     B[-1] = 1
     Sol = np.linalg.solve(M, B)

     return Sol, M
Sol, M = MarkovInfinitySolver(leslie1)
M
array([[-1. , 3.2, 1.7],
[ 0.2, -1. , 0. ],
[ 1. , 1. , 1. ]])print(Sol[0], Sol[1], Sol[2])
0.7306130690201319 0.15471656317788768 0.11467036780198044The Following observation approximately corresponds with the expected observation for n = 20


Comments